Oops! Something went wrong while submitting the form.
Board-ready utility reporting helps UK energy managers prove ROI, control risk, and meet SECR and ESOS requirements by turning validated consumption data into clear financial, efficiency, and carbon insights that leadership teams can act on.
For UK energy managers, the past year has marked a shift from compliance-led reporting to decision-led energy governance. With the ESOS Phase 3 action plan deadline passed, attention has moved to implementation, measurement, and demonstrating value at board level. Yet many organisations still rely on basic cost-per-kWh reports that lack context, comparability, and strategic relevance.
Effective reporting is not just about meeting Streamlined Energy and Carbon Reporting (SECR) obligations. It underpins financial governance, enabling you to justify capital spend, measure the return on efficiency projects, and benchmark performance across sites and against the wider market. This framework explains how to build governance-grade utility reporting that finance, sustainability, and operations teams trust.
What makes utility reporting effective for decision-making?
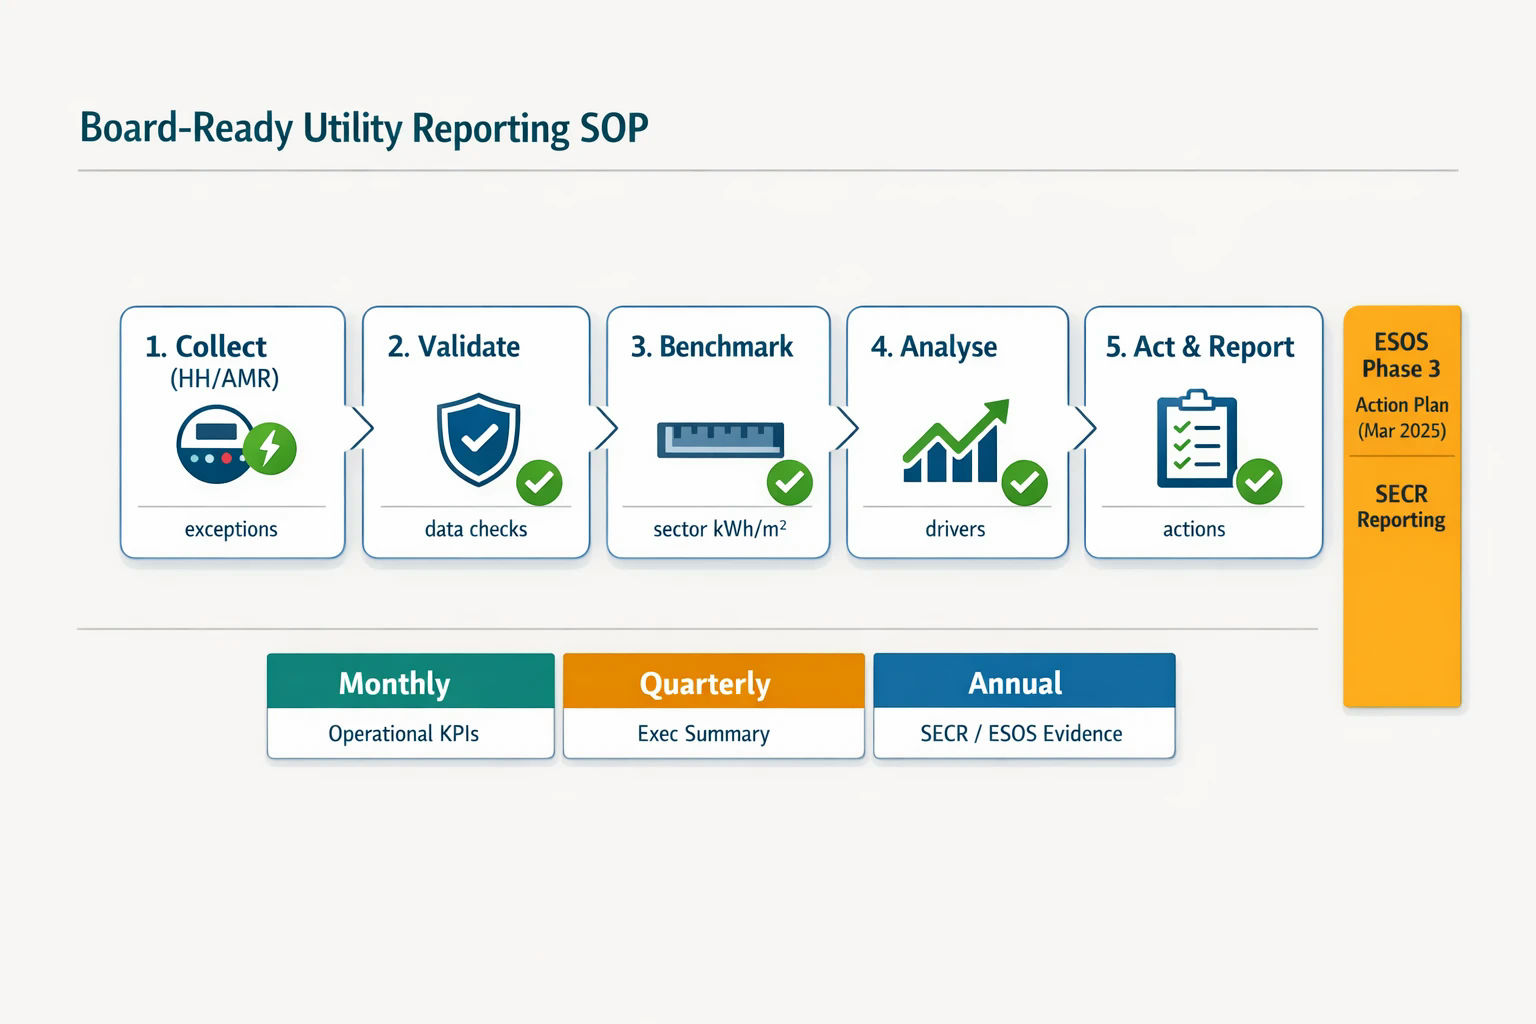
Effective utility reporting combines accurate metering, validated data, benchmarking, analysis, and action tracking. Together, these elements transform raw consumption data into decision-ready insights that support cost control, efficiency investment, and regulatory reporting.
High-performing reporting systems are built on process, not presentation. Organisations struggle when they focus on dashboards without first fixing the quality and structure of the underlying data. A robust monitoring framework rests on five core pillars.
How should energy data be captured across UK sites?
All analysis depends on data accuracy and resolution. Automated Meter Reading (AMR) enables monthly visibility, whileHalf-Hourly (HH) metering records consumption every 30 minutes, supporting demand analysis, peak avoidance, and load shifting strategies.
Why is data validation essential for utility reporting?
Utility data often contains gaps, estimates, and errors. Validation cleanses this data, flags anomalies, and creates a single source of truth, ensuring reports reflect real performance rather than distorted or incomplete information.
2. Data validation
Unvalidated data undermines confidence. Estimated reads, communication failures, and tariff errors can materially skew KPIs. Validation ensures reporting accuracy across all meters and all sites, not just high-level totals.
How do benchmarks improve energy performance management?
Benchmarking compares your energy intensity, measured in kilowatt-hours per square metre, against sector norms. This context identifies underperforming sites quickly and helps prioritise audits and efficiency investment.
3. Benchmarking
Without benchmarks, consumption figures lack meaning. Energy intensity (kWh per m²) allows fair comparison between sites of different sizes and functions, highlighting assets that merit immediate investigation.
How does analysis turn data into savings opportunities?
Energy analysis links consumption trends to operational drivers such as weather, occupancy, and production schedules. This reveals avoidable waste, rising base loads, and cost-saving opportunities hidden in raw data.
4. Analysis and insight
This stage answers why consumption changed, not just how much. Identifying overnight baseload creep or weather-adjusted anomalies often leads directly to low-cost, high-impact interventions.
How should insights be reported to leadership teams?
Action-focused reporting tracks the financial and carbon impact of efficiency measures over time, proving return on investment and reinforcing accountability across teams and sites.
5. Action and reporting
Insights only matter when acted upon. Reporting should show what was done, what it cost, and what it delivered, closing the loop between analysis and outcomes.
Are your sites over-consuming compared to UK benchmarks?
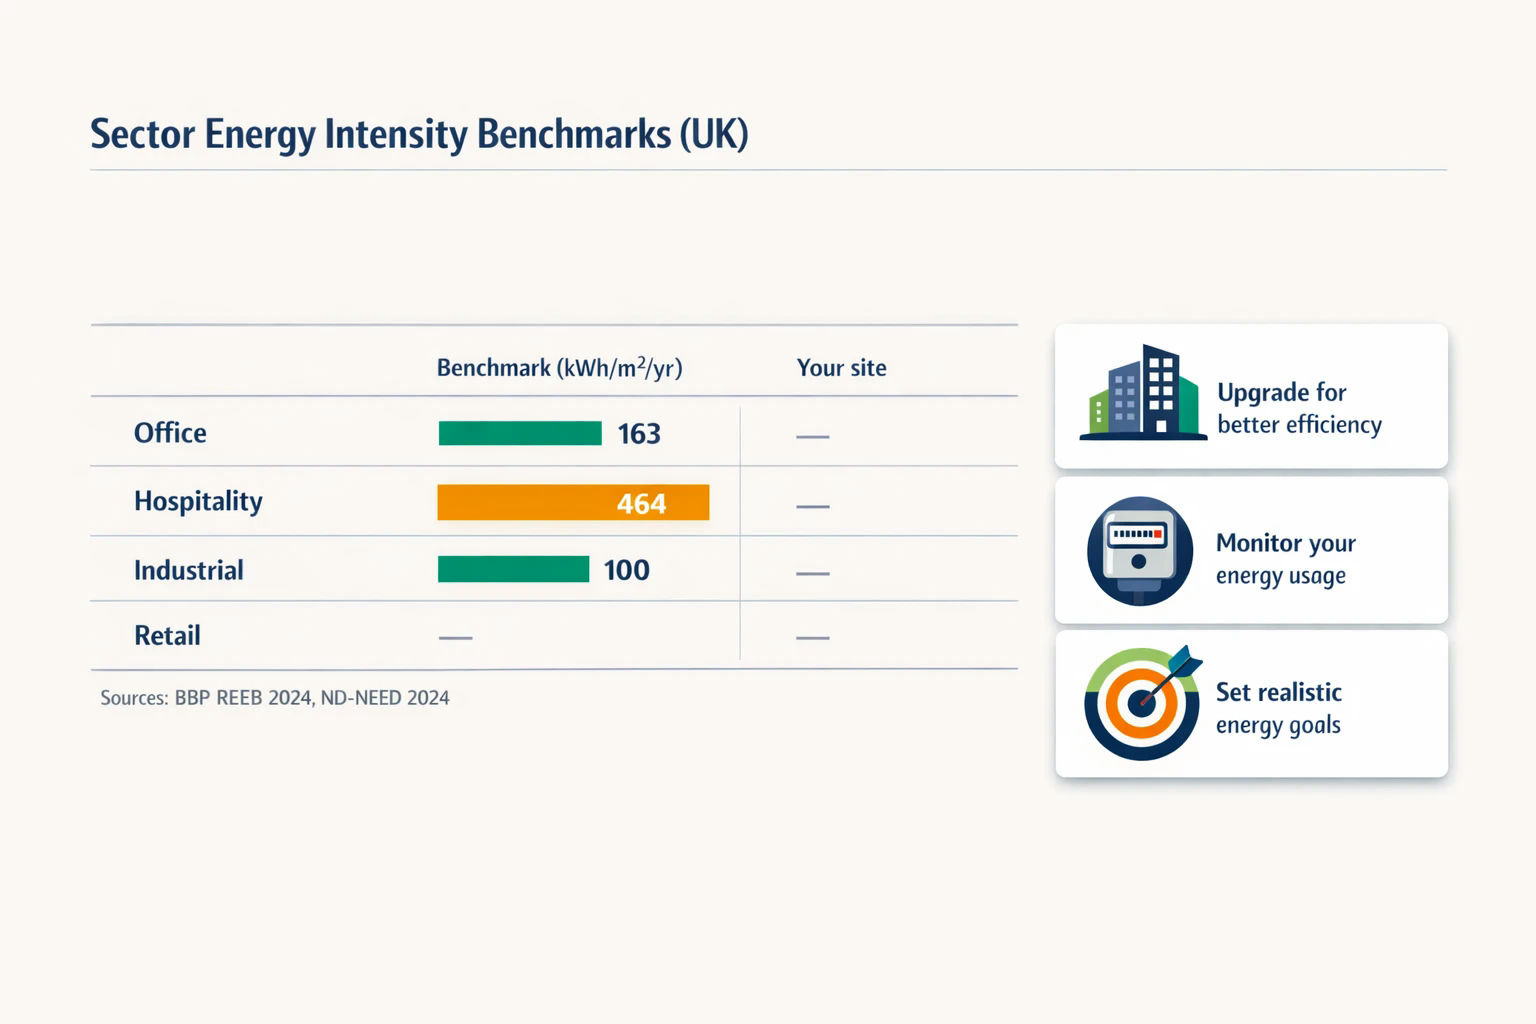
Comparing site energy intensity against UK sector benchmarks quickly reveals over-consumption. Large gaps signal priority sites for audits, controls review, or operational change.
One of the fastest ways to assess performance is to compare your sites against typical UK energy intensity benchmarks. Calculate your site intensity using total annual kWh divided by total floor area in square metres.
Sector Benchmark Energy Intensity (kWh/m²/year) Data Source
Office 163 kWh/m² BBP REEB 2024
Hospitality ~464 kWh/m² (Gas and Electricity) ND-NEED 2024
Industrial ~100 kWh/m² (Gas and Electricity) ND-NEED 2024
Significant variance does not automatically indicate failure, but it provides a clear, evidence-based starting point for deeper investigation.
How do you monitor and report utility performance?
Effective utility performance monitoring requires a repeatable process that transforms raw consumption data into meaningful business insight. Organisations that achieve the best results combine technology, governance, and reporting discipline to maintain visibility across their utility portfolio.
A typical utility performance monitoring process includes:
1. Collect utility data
Gather consumption, cost, and carbon data from electricity, gas, water, and other utility services. Automated Meter Reading (AMR) and Half-Hourly (HH) metering help improve accuracy and reduce manual administration.
2. Validate and cleanse information
Review data for estimated reads, missing values, meter communication failures, and billing anomalies. Validation ensures reporting is based on accurate and reliable information.
3. Establish performance benchmarks
Compare utility performance against internal targets, historical trends, and recognised industry benchmarks. This provides context for understanding whether consumption levels are reasonable or require investigation.
Present utility performance through dashboards, management reports, and executive summaries tailored to finance, operations, and sustainability teams. Reporting should focus on actions, outcomes, and business impact rather than raw data alone.
6. Track actions and outcomes
Monitor the results of efficiency projects, behavioural changes, and operational improvements. This closes the reporting loop and demonstrates the value of utility performance initiatives over time.
By following a structured monitoring and reporting process, organisations can improve cost control, strengthen governance, and support long-term sustainability objectives.
Which utility KPIs matter most to boards and CFOs?
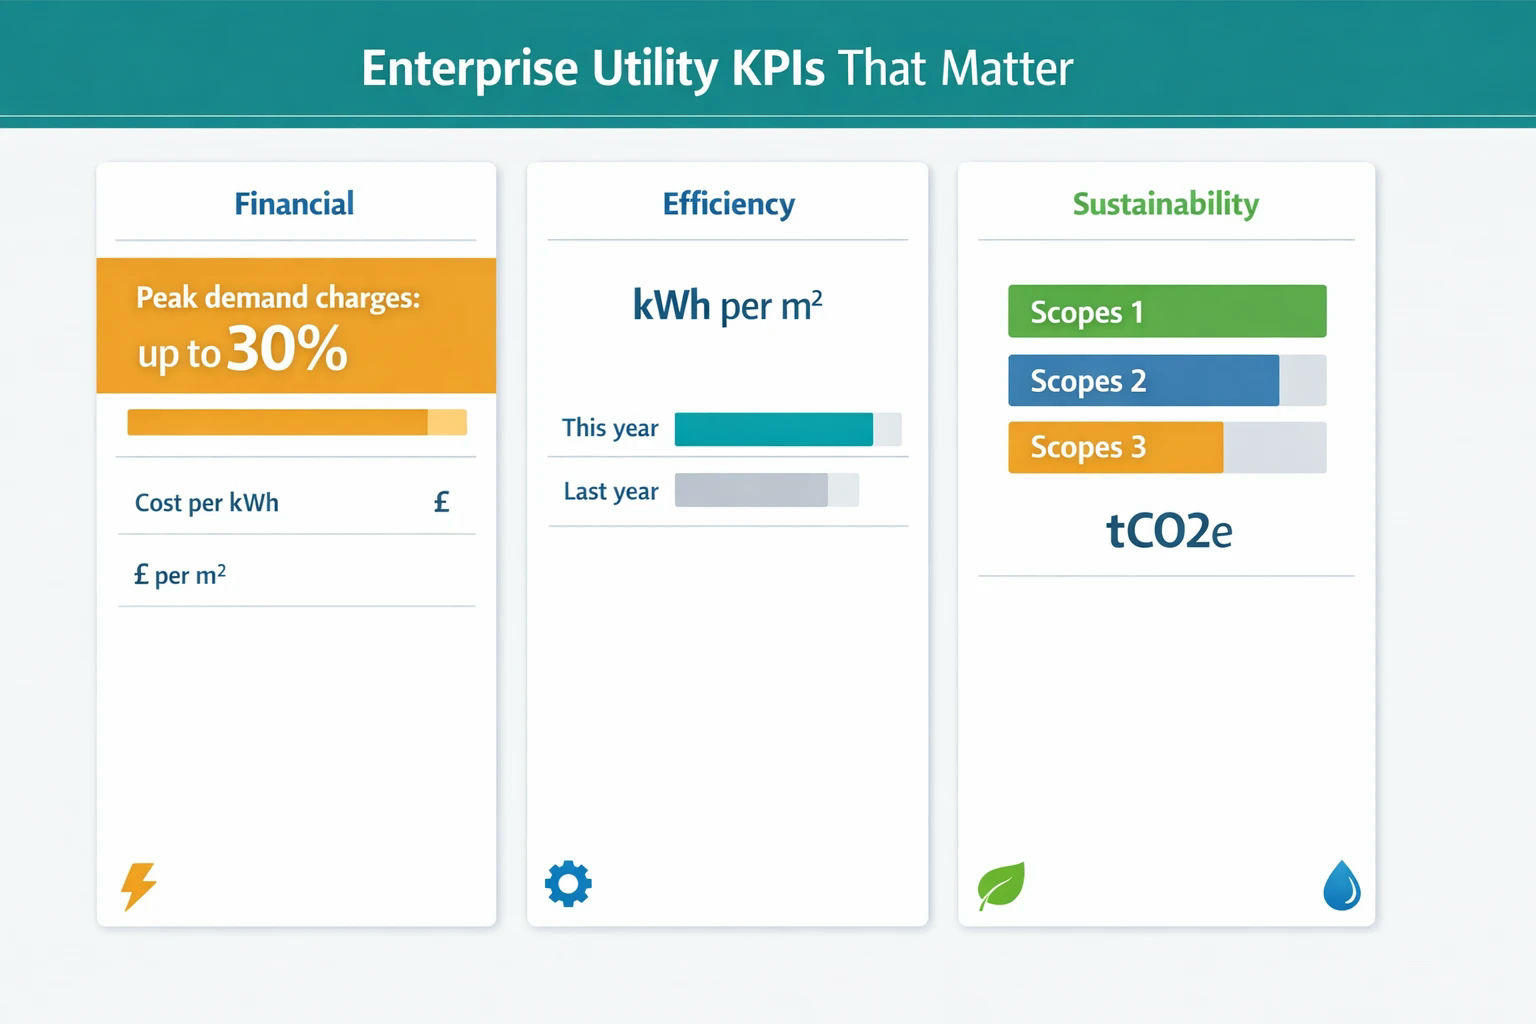
Boards focus on cost control, risk exposure, and carbon performance. Utility KPIs must translate technical data into financial impact, efficiency trends, and emissions accountability.
Financial KPIs
Total utility spend (£) by fuel type
Blended cost per kWh (p/kWh) including non-commodity charges
Peak demand charges (£), which can add up to 30 percent to electricity costs
Scope 3 emissions, including water and other indirect sources
What is the best reporting cadence for governance-grade insight?
A standardised reporting cadence ensures consistent, trusted insight. Monthly reviews support operational control, quarterly reports align leadership, and annual reports fulfil SECR, ESOS, and board-level strategy needs.
Monthly performance review
Focus on data quality, site variance, and issue resolution.
Quarterly leadership update
Summarise portfolio trends, budget performance, and key risks.
Annual compliance and strategy report
Deliver verified SECR data, ESOS progress evidence, and recommendations for the next 12 to 24 months.
How should you evaluate utility monitoring providers?
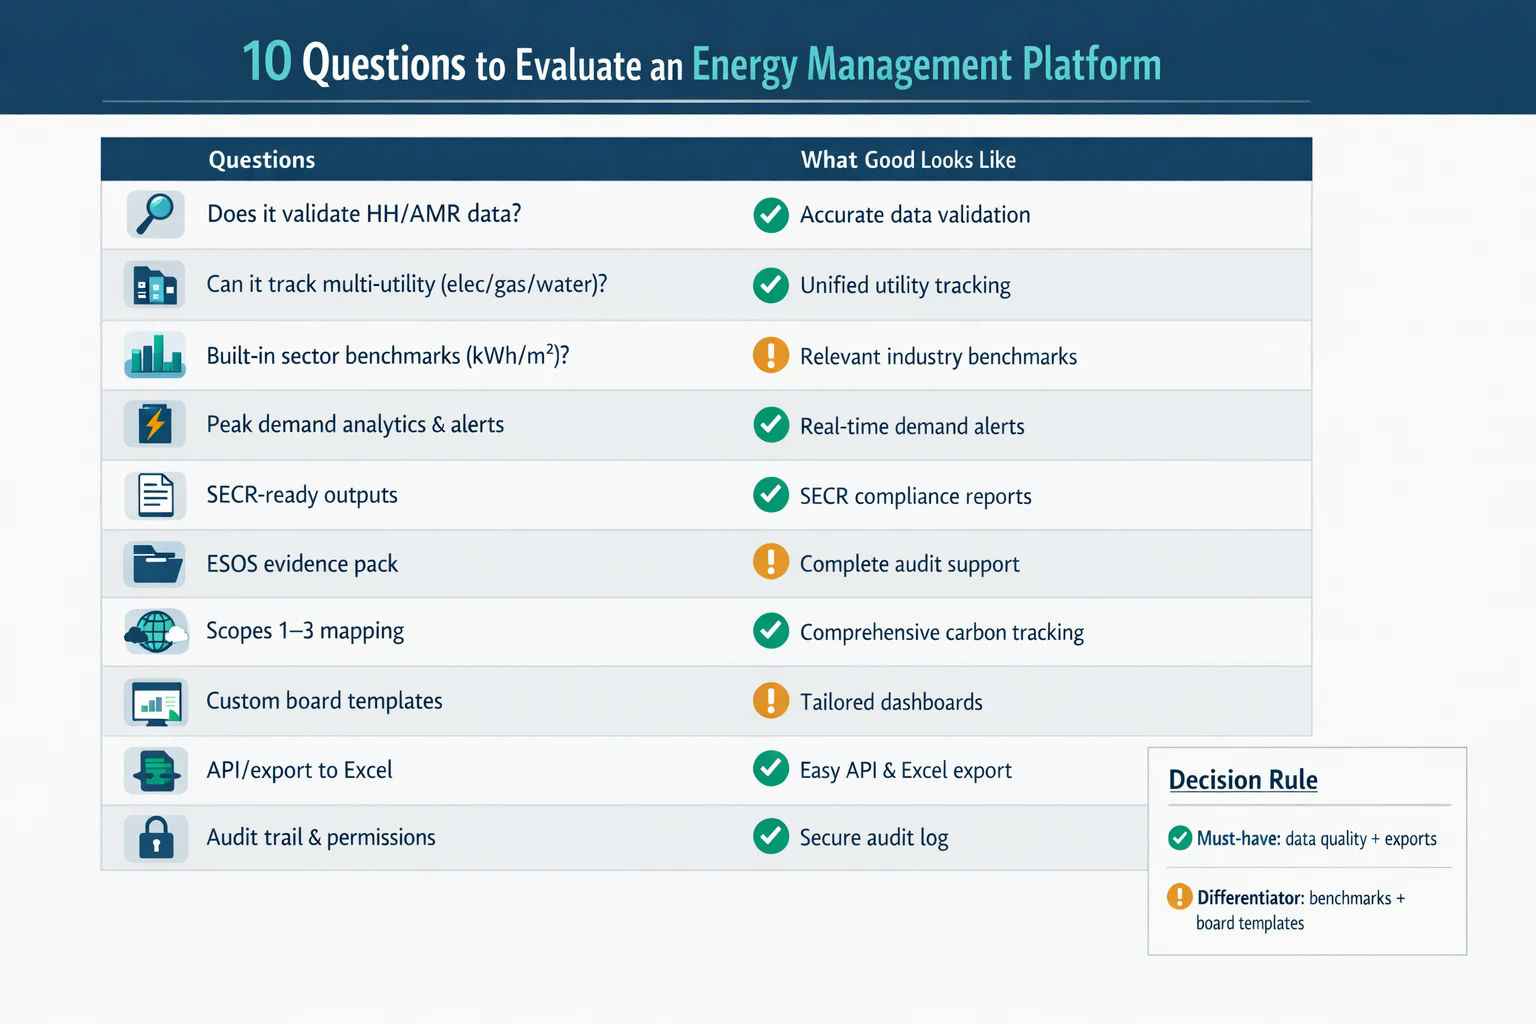
The value of a provider lies in data governance, not dashboards. Strong validation, credible benchmarks, and board-ready reporting matter more than visual design.
Use these questions to assess potential partners:
How is missing or estimated data handled?
Which benchmarking sources are used, and how current are they?
Can electricity, gas, and water be reported in one system?
Which emissions factors are used for carbon reporting?
Does the service support ESOS evidence and SECR submission?
Is support proactive or purely reactive?
Build reporting that delivers strategic value
Utility reporting should enable decisions, not just demonstrate compliance. With validated data, clear benchmarks, and board-aligned KPIs, energy teams can prove value, reduce risk, and support long-term decarbonisation goals.
Build a clearer utility reporting framework with validated data, performance benchmarks, actionable KPIs, and monitoring insights that support cost control, SECR compliance, and smarter energy decisions.